Energy Economics · Time-Series Econometrics
Energy-Adjusted Logistics Forecasting
Does West Coast diesel price movement predict national truck freight rate movement, and at what lag? Distributed-lag OLS and Granger causality testing on 32 years of real public data (EIA diesel prices, FRED freight PPI), then an honest held-out forecast evaluation against a naive baseline.
R²=0.282
Diesel → Freight PPI
p<0.001
Granger Causality, All Lags
26.0%
MAE Improvement vs. Naive
Python
statsmodels
Granger Causality
Distributed-Lag OLS
EIA API
FRED
Part 1: The Data
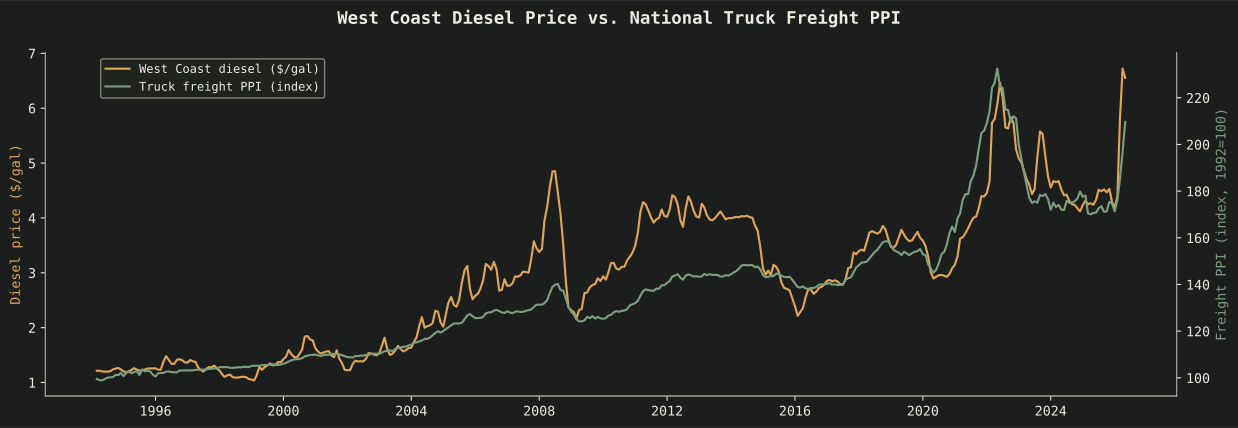
West Coast Diesel vs. National Truck Freight PPI
387 months (1994–2026) of West Coast (PADD 5) weekly diesel retail prices from EIA, resampled monthly, plotted against the national Producer Price Index for Truck Transportation of Freight from FRED. Both series are freely downloadable, no API key required.
Part 2: Does Diesel Actually Predict Freight?
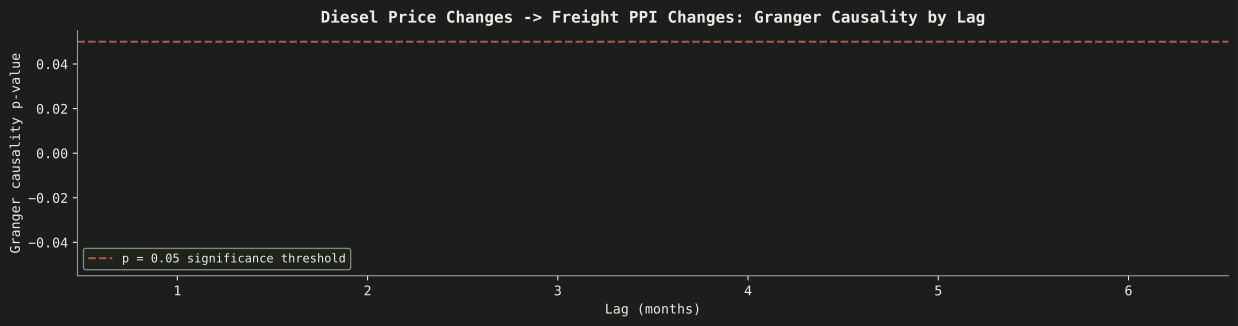
Granger Causality by Lag
Granger causality asks a narrow, testable question: do past diesel price changes improve prediction of freight rate changes, beyond what freight's own history already tells you? Tested at lags 1 through 6 months on month-over-month percent changes (raw price levels aren't stationary, so percent-change is the right transform here).
Every lag from 1–6 months is significant at p < 0.001. Lag 1 (one month) has the strongest signal (F=43.6, p=1.4×10⁻¹⁰).
Part 3: How Much, Not Just Whether
Distributed-Lag OLS
Granger causality tells you a relationship exists; it doesn't size it. A distributed-lag regression (freight_pct ~ diesel_pct_lag0 + diesel_pct_lag1) quantifies it: both the same-month and 1-month-lagged diesel price change are significant predictors (both p < 0.001), together explaining 28.2% of month-over-month variance in the freight PPI (R² = 0.282). A 1 percentage-point increase in diesel prices is associated with roughly a 0.15 percentage-point increase in freight rates over the same and following month (sum of both lag coefficients).
01
Data: EIA + FRED, aligned to monthly
EIA weekly West Coast diesel retail prices resampled to monthly mean; joined with FRED's monthly Truck Transportation of Freight PPI (series PCU4841214841212). 387 aligned months, 1994-03 to 2026-05.
02
Percent-change transform
Both series converted to month-over-month % change before any testing: regressing raw index/price levels on each other would produce spurious correlation from shared trend, not a real relationship.
03
Granger causality, lags 1–6
statsmodels.tsa.stattools.grangercausalitytests on the percent-change pair, identifying the lag with the strongest (lowest-p) relationship.
04
Distributed-lag OLS at the best-fit lag
statsmodels.OLS regression of freight % change on same-month and lagged diesel % change, using the lag identified in step 3.
05
Held-out forecast evaluation
Model refit on all but the last 12 months, then forecasts compared against actuals on those 12 held-out months, the honest test of whether the in-sample relationship is actually forecast-useful.
Part 4: Held-Out Forecast
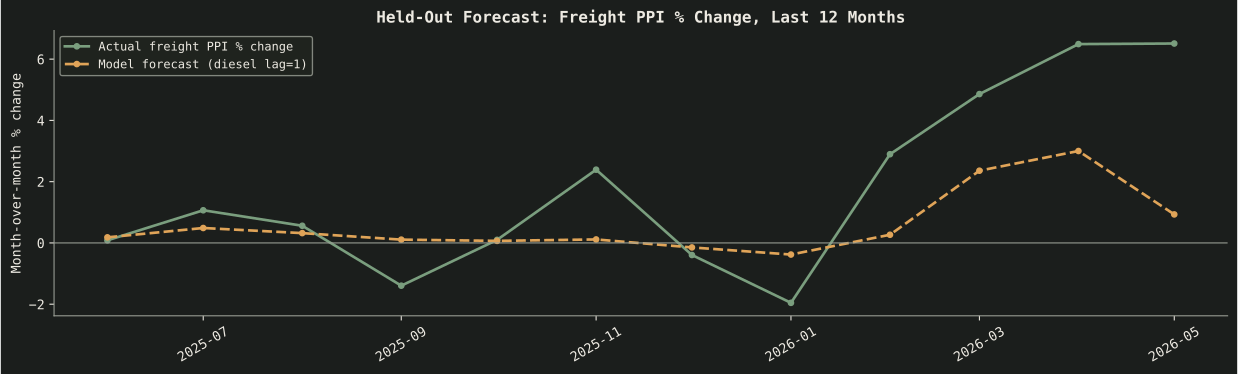
Does It Actually Forecast Better Than a Naive Guess?
The model is fit on all data except the most recent 12 months, then used to forecast those 12 months blind. Compared against the simplest possible baseline: predicting the in-sample average every month.
Result: Model MAE 1.73 percentage points vs. naive-baseline MAE 2.34 percentage points: a 26.0% reduction in forecast error on genuinely held-out data. That's the difference between a statistically significant in-sample relationship and one that's actually useful for a near-term freight budget forecast.
Why This Matters
A Short, Real Lead Time
A 1-month lead time between a diesel price move and its effect on national freight rates is short, but real and statistically defensible: enough to inform near-term freight budget forecasts, the timing of rate lock-ins, or mode-shift decisions (e.g. toward rail) when diesel prices are trending up. The point of the held-out evaluation above is that this isn't just a curve-fit: it beats a naive baseline on data the model never saw.