← Back to portfolio
Transportation Energy · Spatial Optimization

Hydrogen Corridor Routing &
Infrastructure Gap Analysis

GIS workflow comparing two real Oakland–San Jose routes: the shortest path via Niles Canyon (East Bay Hills, +302m elevation gain) vs. the energy-optimal route via the flat I-880 bay corridor. SRTM terrain data and NREL H₂ station locations quantify the trade-off between distance and fuel consumption.

...
Road Network Nodes
...
CA H₂ Stations (NREL)
...
H₂ Savings vs. Shortest
...
Max Gap from Station
Python OSMnx NetworkX GeoPandas NREL API SRTM Elevation Folium Dijkstra's Algorithm
Interactive Map

Corridor Overview

Energy-optimal route via I-880 (orange) vs. shortest-distance route via Niles Canyon (gray). Green circles are real NREL-reported H₂ stations. The two routes are nearly the same distance. The difference is entirely terrain. Dashed blue markers show where each route passes within range of a station.

Dijkstra's on Energy Cost

The road network is fetched from OpenStreetMap via OSMnx, filtered to major roads (motorway, trunk, primary, secondary). Each node gets an SRTM elevation from the Open-Elevation API; edge grades are computed from adjacent node elevation differences.

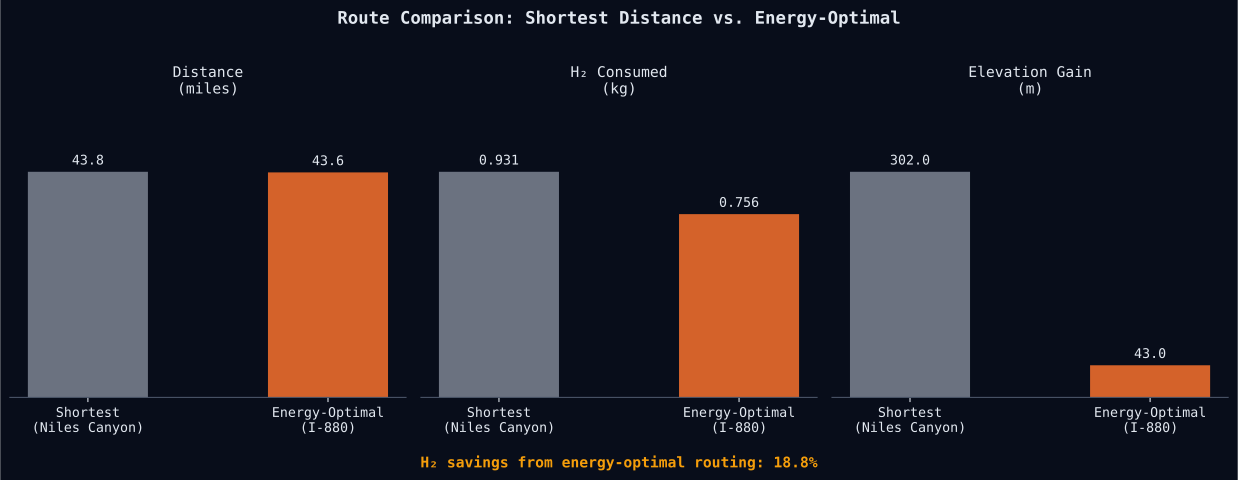
Edge weights: weight = (dist_miles + elev_gain_m / 25) × H₂_kg_per_mile. NetworkX Dijkstra finds the minimum-energy path. The two routes cover nearly the same distance (43.8 mi vs. 43.7 mi). The Niles Canyon route climbs 302m vs. just 43m on I-880.

Result: the energy-optimal route consumes 18.8% less hydrogen despite being the same length. Flat terrain beats shorter distance when the grade penalty is steep enough.
Route comparison: shortest distance vs energy-optimal
Part 1b: Terrain Analysis

SRTM Elevation Profile

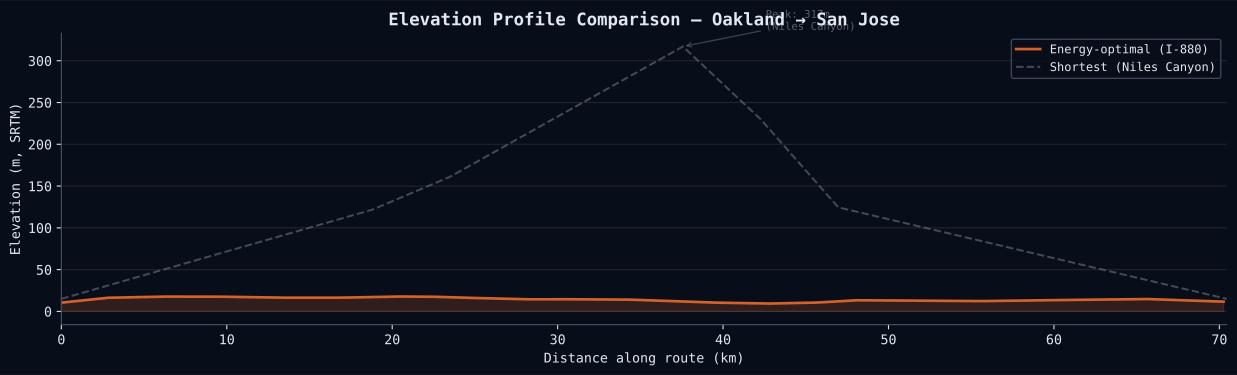
Elevation profiles for both routes overlaid. The orange line (I-880, energy-optimal) hugs sea level at 10–30m for the full 43.7 miles. The gray dashed line (Niles Canyon, shortest-distance) climbs through the East Bay Hills to a 330m peak before descending to Fremont, adding 302m of effective uphill work that directly translates to extra hydrogen consumption.

Elevation profile along energy-optimal route
Along-route H₂ infrastructure coverage

Coverage Gap Analysis

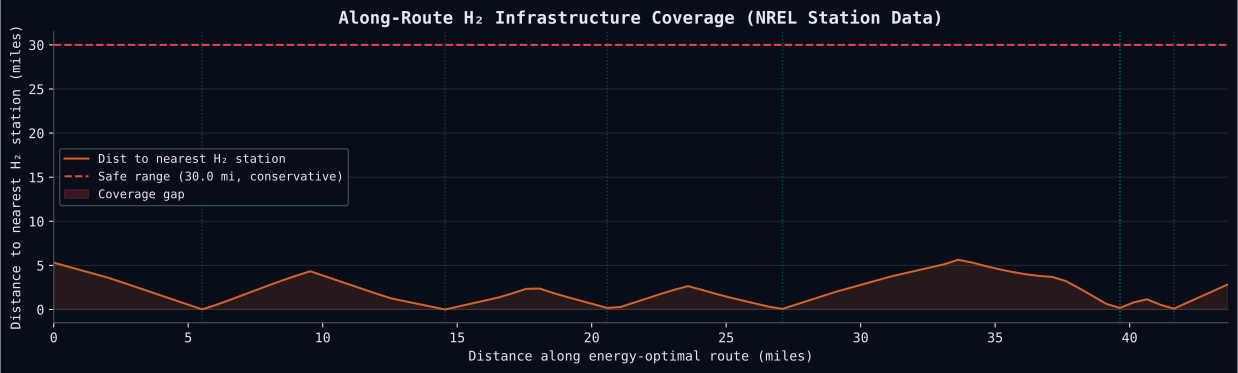
Operational H₂ stations are pulled from the NREL Alternative Fuels Station Locator API (real stations, not synthetic data). 7 stations appear in the Bay Area corridor (True Zero network + Shell). The route is sampled every 500m and the distance to the nearest station is computed in EPSG:3310 (California Albers).

At a 30-mile conservative threshold (appropriate for hydrogen buses in hilly terrain), the Bay Area portion of this corridor is fully covered. The True Zero network provides continuous coverage. This is actually a meaningful finding: the corridor is infrastructure-ready for hydrogen fleet deployment today.

Dotted green lines show where each station projects onto the route. The chart structure generalizes to any corridor where coverage gaps would emerge.

Part 3: Optimal Siting

Infrastructure Placement Under Spatial Constraints

Candidate new station sites are placed at midpoints of coverage gap segments. Candidates are filtered by two spatial constraints: road grade ≤ 5% (flat terrain lowers construction cost and improves heavy-vehicle access) and minimum 10-mile inter-site spacing. The Bay Area corridor at a 30-mile threshold shows no gaps; the siting algorithm is designed to trigger on longer or underserved corridors where gaps do exist.

Constraint 1
≤ 5%
Maximum road grade at candidate siting location. Steep terrain increases excavation, retaining structures, and equipment delivery cost for hydrogen infrastructure.
Constraint 2
10 mi
Minimum spacing between recommended new sites. Prevents clustering and ensures each site adds the maximum new coverage relative to existing stations.
Bay Area finding
Covered
At a 30-mile conservative threshold, the Bay Area I-880 corridor is fully served by existing stations. No new siting required. Corridor is infrastructure-ready.
Data source
Real
Station locations from NREL AFSL API. Road network from OpenStreetMap via OSMnx. Elevation from NASA SRTM via Open-Elevation. No synthetic data.
Methodology

Pipeline

End-to-end spatial optimization pipeline. Each step uses real external data sources; the analysis is fully reproducible from the Jupyter notebook.

OSM Network
OSMnx
SRTM Elevation
Open-Elevation
Energy Weights
NetworkX
Optimal Route
Dijkstra
NREL Stations
REST API
Coverage Gaps
GeoPandas
Siting
Constraints
01

Road Network: OpenStreetMap via OSMnx

Fetches the drivable road network within the Oakland–San Jose bounding box, filtered to major road types via ["highway"~"motorway|trunk|primary|secondary|..."]. Graph is simplified to merge parallel edges and remove intermediate degree-2 nodes.

02

Terrain Elevation: NASA SRTM via Open-Elevation API

Batch-queries SRTM 30m elevation data for every node in the graph. SRTM (Shuttle Radar Topography Mission, NASA 2000) provides near-global terrain coverage at 30m resolution, a real remote sensing product. Edge grades are computed from adjacent node elevation differences.

03

Energy-Weighted Routing: NetworkX Dijkstra

Each edge gets energy_cost = (dist_miles + elev_gain_m / 25) × (1/60). The 25m constant comes from empirical H₂ vehicle efficiency data: 25m elevation gain ≈ 1 extra effective mile of consumption. NetworkX finds the shortest path on this energy graph.

04

Station Coverage: NREL Alternative Fuels Station API

Pulls all operational (status=E) hydrogen (fuel_type=HY) stations in California. The route is sampled every 500m and for each sample point the distance to the nearest station is computed in projected EPSG:3310 (California Albers). Coverage threshold: 30 miles (conservative for heavy vehicles on varied terrain).

05

Optimal Siting: Spatial Constraints

Contiguous gap segments are identified and midpoints become candidate sites. Grade at each candidate is computed from incident edge grade_abs values from the OSM graph. Candidates failing grade > 5% or spacing < 10 mi are eliminated. Remaining candidates are ranked by distance from nearest existing station.

View Notebook on GitHub → ← Back to portfolio